
A Tasty Strategy for Liquidity Providing
A Tasty Strategy for Liquidity Providing

Liquidity
Definition: In cryptocurrency, liquidity refers to the ease at which digital assets can be bought, sold, or transferred.
What This Means: For any market to operate efficiently, liquidity must be present. Liquidity, which means how easily an asset can be transferred to cash, is highest in markets with numerous participants. In addition to market participants, market makers are often employed to boost liquidity. Market makers buy the bid and sell the ask to satisfy the market, pocketing the difference, or the spread, as their profit. In DeFi, DEXs (decentralized exchanges) use smart contracts and liquidity pools to replace traditional market makers.
- Source
What is liquidity providing (LP)?
To understand liquidity providing, we must first understand how traditional markets work. The following sections will give a brief overview of the differences between traditional and decentralized exchanges.
The Traditional Order Book
In traditional finance, markets such as the stock market use something called an Order Book. When a trader wants to place an trade they submit an order to their brokerage firm, which in turn is routed to the exchange. When the order is matched with an opposite order on the book then it is sent back to the brokerage to be reported to the trader.
Traditional market maker firms, commonly referred to as High-Frequency Traders, make their profit by quickly pairing buy and sell orders. In turn, they make the stock market very liquid. Many stocks can support thousands, if not hundreds of thousands, of dollars in orders within an instant; without changing the price significantly.
Over time, this centralized process of managing an order book has evolved to become extremely efficient and liquid enough to handle intra-day trading. However, it comes with the downside of being centralized which leaves the door open for human error or a centralized system failure; such as a server outage.

The Automated Marker Maker (AMM)
With the rapid evolution of decentralized finance came a few methods of removing the middle-man from financial transactions. One of these methods was an Automated Market Maker system which can allow orders to be paired with existing liquidity automatically and leave no room for arbitrage or front-running.
Imagine the case of Robinhood, where they were able to offer commission-free trading by selling your orders to specific firms and in a sense allowing them to front run your order by pennies each time.
The beauty of this system is that the barrier for entry is very low. Anyone can add liquidity to a pool and begin to earn fees when the AMM system pairs your liquidity with someone who wants to swap their coins.
However, earnings fees is not risk-free! Liquidity providers are still susceptible to impermanent loss and price risk — which we will discuss shortly.
Successful liquidity providing is a delicate balance between finding the right pool, setting efficient liquidity ranges and rebalancing in a timely manner.
Click here to learn more about the Automated Market Maker and Impermanent Loss
Making Money by Providing Liquidity
When a trader wants to add liquidity to a pool there are a few considerations. Firstly, the trader must choose which pool to provide liquidity to. This means choosing two tokens which other traders can swap between and pay fees for the swap.
Pools will volatile tokens will offer higher yields but in turn open up the possibility for more risk. Likewise, pools with non-volatile tokens will offer lower yields.
The next consideration is the liquidity range. When a trader sets a range, their tokens are spread out along the entire range to offer liquidity at various price points. A tighter range will mean that more of your tokens are being used in swaps and less are sitting around at unseen prices. This will lead to more fees earned.
Finally, the rebalancing period must be considered. Due to the nature of price movements in tradeable assets, it is inevitable that your liquidity range will be broken and some impermanent loss is seen. Rebalancing too often may lead to constantly buying tops, and selling bottoms… while taking too long between cycles will lead to occasions where the price is outside of the range for an extended period of time and no fees are earned.
As mentioned before, it is the balance between these three considerations which creates a powerful liquidity providing strategy.

A Tasty Strategy for Successful LP
Understanding impermanent loss, slippage, and how fees are earned poses a new question.
Given the intense volatility often seen in the crypto markets, how does a trader effectively set-up, monitor and rebalance a liquidity pool in order to capture excess returns while avoiding significant risk?
In this article, I propose a strategy which follows the principles presented by TastyLive in regards to the traditional equity markets. This strategy will look at options data in order to get a deeper look at how participants in the market are positioned and what they are expecting.
The hypothesis we are following is that the options chain is an efficient place to take “bets” on any insider or valuable information and therefore can exhibit a predicative power for future realized volatility.

Step 1: Understanding Implied Volatility
The most important metric for this strategy is implied volatility. This uses the observed option pricing to see how much the price is above its theoretical fair value. The more “overpriced” an option is, the higher its IV will be.
Implied volatility (IV) in the market refers to the forecasted magnitude, or one standard deviation (SD) range, of potential movement away from the underlying price in a year's time.
IV is not a guaranteed metric, but it’s helpful in traders understanding ranges from a statistical perspective to help with risk management, buying power, etc.
Low implied volatility environments tell us that the market isn’t expecting the stock price to move much from the current stock price over the course of a year. Whereas, a high implied volatility environment tells us that the market is expecting large movements from the current stock price over the course of the next twelve months.
Along with the basic implied volatility calculation, we are blessed to have a multitude of research on this matter conducted by TastyLive and according this research we find that we can typically expected realized volatility to be lower than what was expected.
The chart below shows the difference between implied volatility and realized volatility by year (2004 to 2017):

According to the chart above, 2017 was much closer to an "average" year when it comes to the difference between implied volatility and realized volatility. From this perspective, the true outlying year in history is 2008, when realized volatility was actually higher than implied volatility - the only such instance over the period examined.
Step 2: The Expected Move Formula
Once again we take inspiration from TastyLive to continue developing the strategy. By calculating the expected move, we get a range where market participants are relatively confident the price will stay between… Seems perfect for eliminating the concern of efficiently setting our liquidity range.
At tastylive, we use the ‘expected move formula’, which allows us to calculate the one standard deviation range of a stock. This is based on the days to expiration (DTE) of our option contract, the stock price, and the stock's implied volatility.

EM = 1SD expected move
S = stock price
IV = implied volatility of your option’s expiration cycle
DTE = days to expiration of your option contract
For example, the 1SD expected move of a $100 stock with an IV percentage of 20% is around $20 of the current stock price, or a range between $80 and $120.
Before diving into how this impacts options trading, it’s important to understand the probabilities associated with certain multiples of standard deviations:1SD of a stock encompasses approximately 68.2% of outcomes in a distribution of occurrences based on current implied volatility
2SD of a stock encompasses approximately 95.4% of outcomes in a distribution of occurrences based on current implied volatility
3SD of a stock encompasses approximately 99.7% of outcomes in a distribution of occurrences based on current implied volatility
Think of any stock (or underlying product) you like, and consider tracking how many times in a row it goes up in price, or down in price, for consecutive days. Over a large window of time, you’ll see that the vast majority of stock price movement would land in the 1SD range of outcomes, or 68.2% of the time. And 95.4% of the time with a 2SD range and 99.7% with a 3SD range.

Step 3: Application
Before we can start earning fees, there are still two considerations which we must address.
Which pool to choose?
When to rebalance/switch pools?
Choosing a pool is a manual scanning process. We can use a tool like Uniswap Analytics to scan pools for a high Volume/TVL ratio. This helps estimate how much we can earn from fees. Choosing a pool with one token as a stablecoin can help reduce the volatility of the pool and make it easier to reduce impermanent loss; however, this will come with slightly reduced APR.
Another factor for choosing a pool is the availability and liquidity of options for the tokens within the pool. At the time of writing this article, only BTC and ETH have liquid enough option chains across various protocols to conduct further analysis.
As for rebalancing, I would suggest 15-30 days which would be inline with the options expiration cycles. This allows for some times to capture fees and rebalance to adjust to new market conditions in a timely manner.
Now that we have selected a pool, we must calculate and set the liquidity range.
For simplicity sake, we use an alternative calculation for the Expected Move Formula.
According to TastyLive,
You can use the following formula with ATM options to get the expected move with a 99% accuracy:
EM =
60% ATM STRADDLE +
30% ATM+1 STANGLE +
10% ATM+2 STRANGLE
For the purposes of this article we will simplify this even further and just use the ATM Straddle price as the expected move range.
Options data can be found using the CME Bitcoin Futures Option Chain or using the Deribit exchange for data. Eventually, some decentralized protocols such as Lyra might provide additional data.

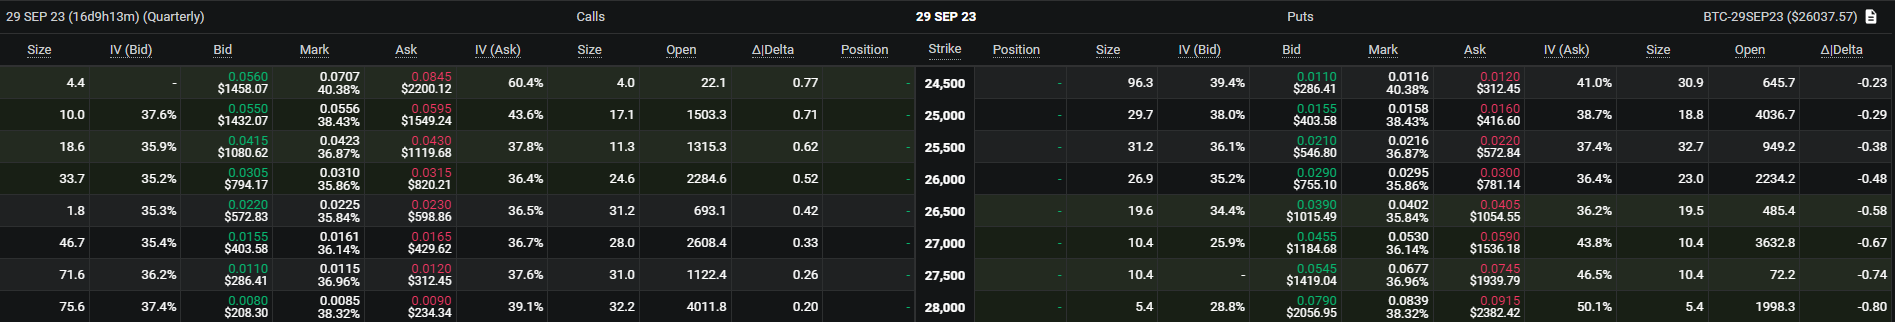
Deribit shows an expected move of +/- $1570 within the next 15 day period.

Barchart shows an expected move of +/- $1650 within the next 15 day period.
Let’s simulate our position!
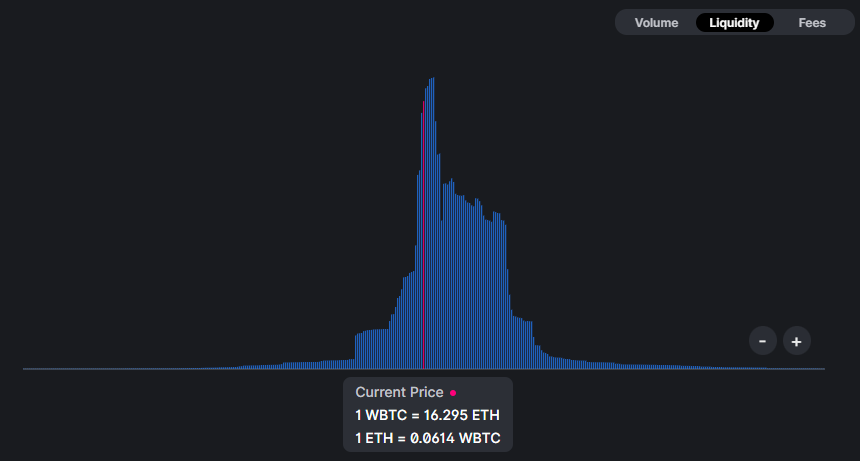
In the image below, we can see a simulation on BuildrMetrics. On the right, the liquidity range is set as an average of our calculated expected moves (+/- $1600).
We use the last 7 days of fees to estimate how much we can potentially earn. Thanks to the ranges we set up; we can collect ~29% APR in fees (not considering risk).

The next image shows the difference if the liquidity range had been set wider. Much lower APR generated from fees since our liquidity is more spread out…

Clicking on the Calculate Impermanent Loss button will allow us to run some more in-depth simulations.
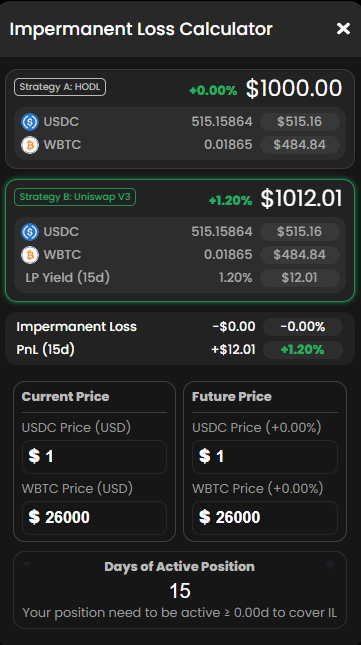
If the market stays flat, we make 1.2% excess returns in 15 days.

If the market rallies to the upper boundary, we underperform by 0.3%.

If the market falls to the lower boundary, then we underperform by 0.42%.
With a bit of rounding and over-simplification, we can calculate the expected value of this trade as such:

Conclusion
While liquidity providing might seem like a complex concept from the outside; this is actually the most genuine way of making an income in the crypto space.
The strategy demonstrated above gives an example of how to effectively identify an opportunity in the LP space. As time progresses, more tokens will have an options chain, and as they grow in liquidity, so will the information content of the trading information.