
2 New Leading Indicators for Trading
2 New Leading Indicators for Trading
Using untapped fundamental indicators for trading alpha. Code examples included!

In this article, I will introduce two new fundamental indicators which are available online for free! With a barrier to entry, of course.
INDICATOR 1 - OPEN JOB LISTINGS OVER TIME
An interesting observation I made one day was that every publicly traded company had a website, and within these websites is usually a link to the “Careers” portal.

Above, we can see the link to the careers portal at the bottom of the Intel website.

Within the careers portal, we can see EVERY job currently listed across the globe. Some websites even feature a total job counter to indicate how many items/pages are available for viewing; this is a common HTML feature.

USE CASE:
Capturing vacancy duration using the creation and deletion dates of job postings by US public firms, we examine the informativeness of vacancy duration for future firm profitability. We find that while firms that quickly fill low-skill job vacancies exhibit higher future profitability, firms that take more time to fill high-skill jobs exhibit higher future profitability.
We find that changes in the number of job postings are positively associated with changes in future performance and that this relation is stronger when postings likely represent growth rather than replacement. Consistent with job postings providing new information to the market, investors react positively to changes in the number of job postings. The market reaction to postings is stronger when firms are likely to be hiring for growth rather than replacement and for firms with low labor intensity (and therefore high marginal productivity of labor).
INDICATOR 2 - JOB LISTINGS BY DEPARTMENT
With this newfound source of data, we can begin to explore the possibilities of how to visualize it.
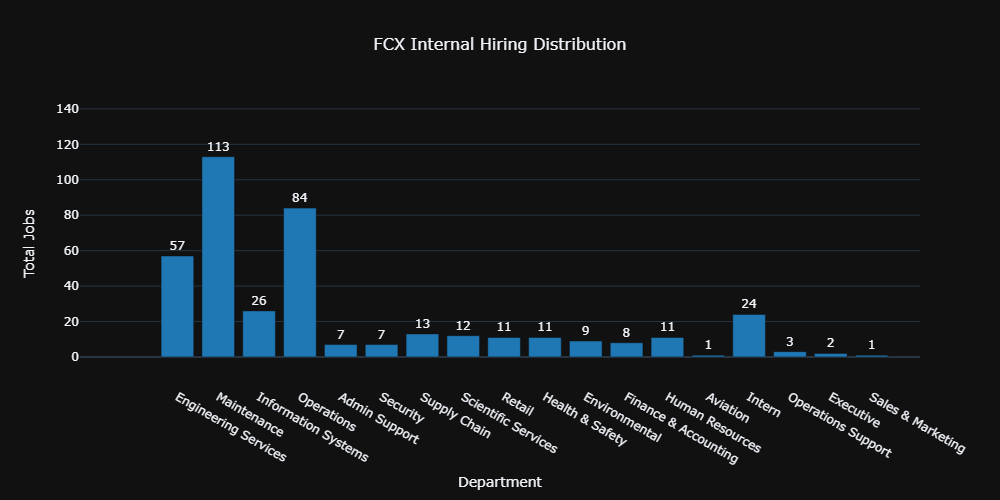
Some career portals feature more readily available information than others. An example such as Freeport-McMoRan (FCX) also provides us with the department in which each job is hiring.

We can create a bar graph showing the current status quo of per-department hiring.
USE CASE:
While not much research seems to have been conducted regarding the effects of per-department hiring; we do have some data to work from.
RavenPack created a long-only portfolio that uses tech adoption and job hiring. They boast an information ratio of 1.4 and an annualized excess return of 3.4%. This suggests that there is alpha when it comes to understanding where a company is hiring and how they are adopting new technology. Click here to learn more.
This may also be insightful to see which stage of production they are in. Startup/small companies may only be running a few, or even just one, production cycle at a time, and job listings could give early insight as to the progress of production.
HOW TO START USING THESE METRICS
DATA SCRAPING
Web scraping is the process of automating the extraction of data from websites. It's like having an army of digital ants that crawl through the web, gathering data at an unprecedented scale. This technique has evolved into a sophisticated discipline, blending coding, data analysis, and ethics elements.
At its core, web scraping involves sending HTTP requests to a website's servers, receiving web pages as responses, and then parsing the HTML or other structured data to extract the desired information. While it may sound straightforward, scraping can range from simple one-page extractions to complex, multi-site data aggregation.
CODE EXAMPLES:
INDICATOR 1:
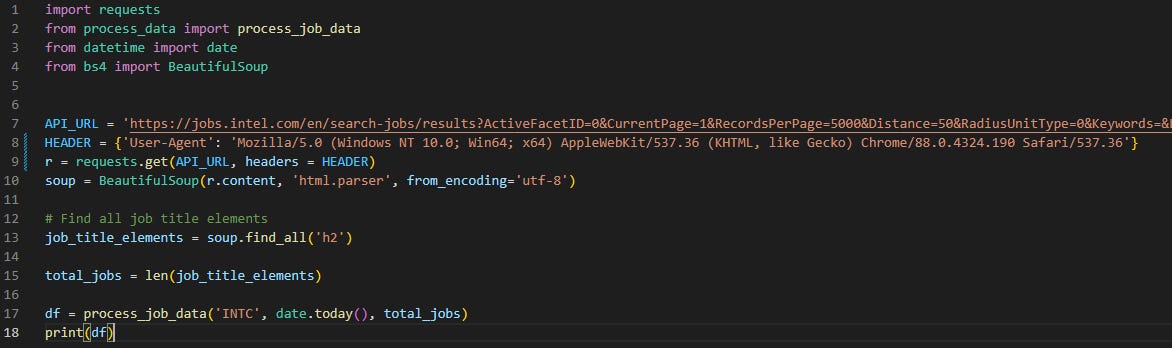
The code above shows indicator 1. Once we have identified the URL containing the data we desire. Simply, make an API request with the browser tags in the header. We can use the library BeautifulSoup to efficiently process the HTML and pull out the data we are looking for.
INDICATOR 2:
Some websites will require a bit more work than others to get all the data. In the example below, I had to manually request each page to get the data.


However, once you have paired the open job count to each department you can now plot this as a bar chart.
CONCLUSION
Overall, we can see that a few nice metrics can be derived from readily available data online. Along with this, some research suggests that this data may contain a decent amount of alpha potential.
The main problem with this data is the difficulty of collecting it. While managing scripts for 10-20 websites may be doable; once it reaches into the hundreds it becomes difficult to maintain websites and URLs as they change. If an efficient method of collecting this data was available then it could be worthwhile to pursue further research into this.
If you enjoyed this post then feel free to subscribe to The Research Report to stay updated with any new research from the Trading Delta team.